Section Breaks appear to not be functioning for calls to subjectProfileLinePlot and subjectProfileTextPlot #3
Description
I am having difficultly adding section breaks and section break titles between the patientProfilesVis R package sections. For example I am running these calls to the patientProfilesVis package:
egPlot2 <- subjectProfileTextPlot(
data = dataEG,
paramValueVar = c("EGTEST", "EGORRES", "EGORRESU", "EGDTC"),
paramGroupVar = c("EGDTC" ),
title = " Electrocardiogram ECG (Start - End)",
labelVars = labelVars,
paging = TRUE,
table = TRUE,
subjectVar = "SUBJID"
)
patientProfilesPlots <- c(patientProfilesPlots, list(EH = egPlot2))
moPlots <- subjectProfileTextPlot(
data = dataMO,
paramValueVar = c("MOCAT", "MOORRES", "MODTC"),
paramGroupVar = c("MODTC" ),
title = " Clinical Assessment of Radiograph Imaging (Start - End)",
labelVars = labelVars,
paging = TRUE,
table = TRUE,
subjectVar = "SUBJID"
)
patientProfilesPlots <- c(patientProfilesPlots, list(MO = moPlots))
prPlots <- subjectProfileTextPlot(
data = dataADPR,
paramValueVar = c("PRDECOD", "PRTERM", "PRSTDTC", "PRENDTC"),
title = "Concomitant Non Drug Procedures (Start - End)",
labelVars = labelVars,
paging = TRUE,
table = TRUE,
subjectVar = "SUBJID"
)
patientProfilesPlots <- c(patientProfilesPlots, list(PR = prPlots))
The patientProvilesVis calls above generate the PDF file output
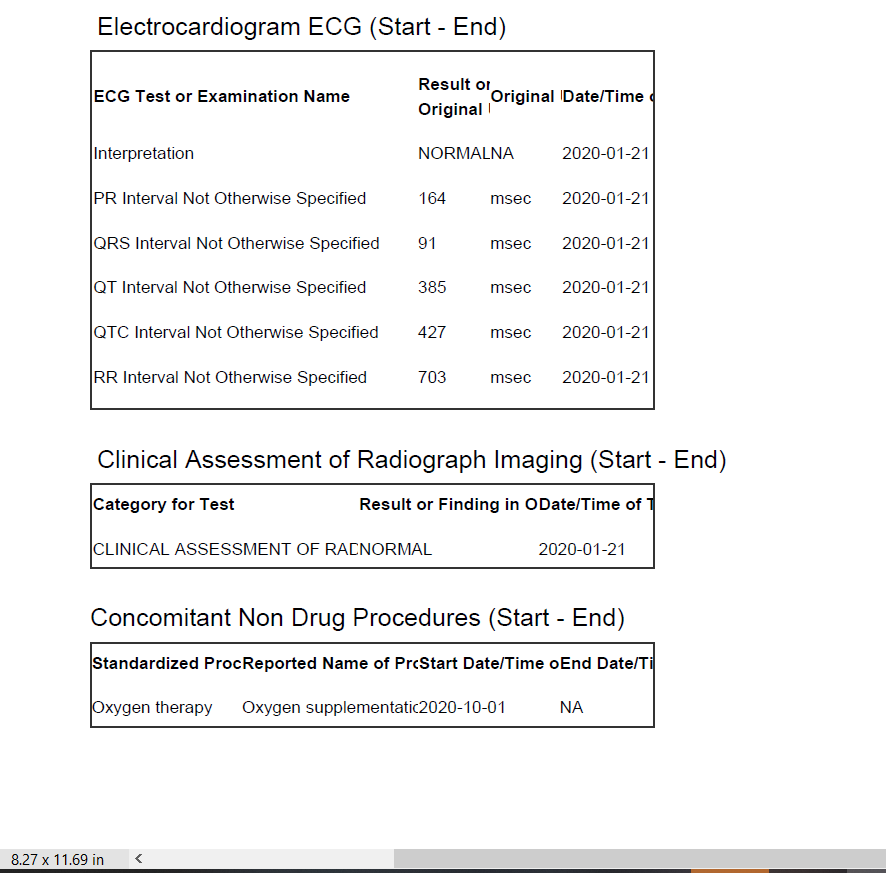
Notice that the output produced has no section breaks and no section break titles are displayed between the 3 calls to subjectProfileTextPlot().
I did create values for the sectionTitles though. If you run the code in R Studio, then click on the template tab (in R Studio) for subjectProfile.Rnw, here we can see that the section breaks are defined and are associated with the listPlots object.
Simply run this R code in R Studio to view the section break values:
sectionTitles <- sapply( seq_along(listPlotsPerSubjectList), function(i) {
-
attr( listPlotsPerSubjectList[[i]], "metaData")$label })
sectionTitles[10:12]
[1] " Electrocardiogram ECG (Start - End)" " Clinical Assessment of Radiograph Imaging (Start - End)" "Concomitant Non Drug Procedures (Start - End)"
My reference above to elements 10 to 12 is just to illustrate a section of my total PDF output and a section of the total R code. I am including 3 sections of the code and 3 associated sections of the PDF file output.
So above you can see that I have taken steps to associate the section breaks and the section break titles with the listPlotsperSubjectList object. And yet the PatientProfileVis package seems to not display my section breaks and section titles in my PDF output.
Please note that the original R package for PatientProfileVis defines the sectionTitles in this way:
sectionTitles <- unlist(lapply(names(listPlotsPerSubjectList), function(subject)
c(subject, rep("", length(listPlotsPerSubjectList[[subject]])-1)))
)
I have found that this does not work though as it also does not properly associate my sectionTitles values to the PDF output produced.
I would really like to get section breaks and section titles to work. I am investing a lot of hours into getting this to work.
If anyone has examples of the patientProfilesVis R package working probably with regards to the sectionTitles processing then please send those hints and suggestions to me. This is a priority for me.